使用OOcharts嵌入Google Analytics資料圖表到你的網站
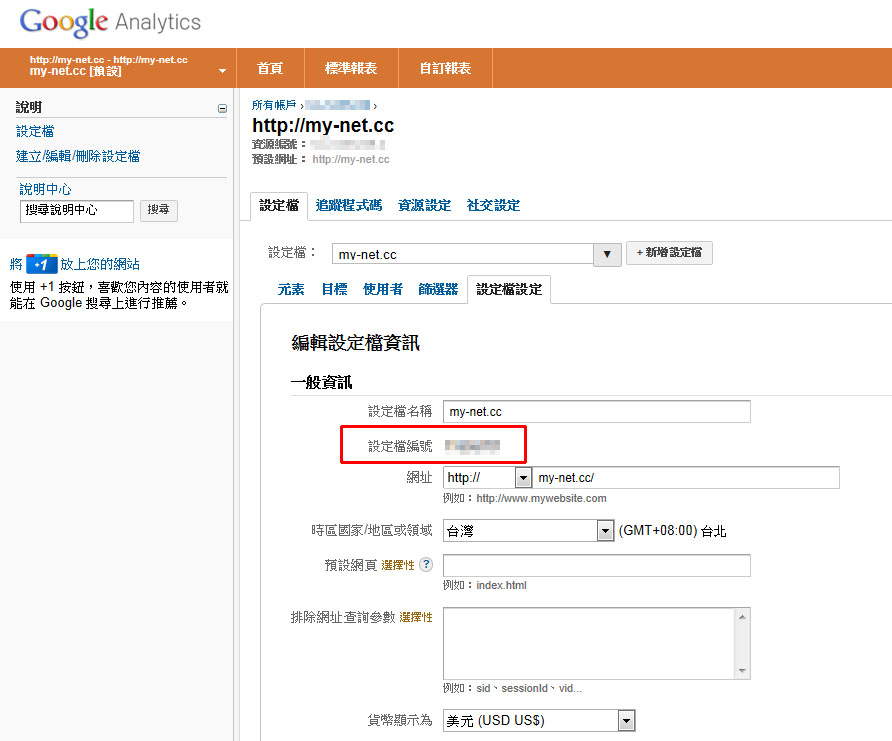
OOcharts首頁有放幾個Demo,提供免費下載script自行安裝,壓縮檔案內也有寫好的範例。先取得OOId,自動連線到Google Analytics詢問是否同意讀取資料,同意後就會自動建立一個OOId。再來是取得Google Analytics profile id,請參考下圖︰
最後開啟範例檔案,輸入相關資料,例如timeline.html︰
<!DOCTYPE html>
<html>
  <head>
    <meta charset="utf-8" />
    <title>Timeline Example</title>

    <!--Load the oocharts script-->
    <script src="../oocharts.js" type="text/javascript"></script>
  </head>
  <body >
    <script type="text/javascript">

      //Set your ooid
      oo.setOOId("輸入ooid");

      //load reqs
      oo.load(function()
      {
        //Create a new timeline (aid, startDate, endDate)
        var tl = new oo.Timeline("輸入Google Analytics profile id", new Date("輸入讀取資料的開始日期mm/dd/yyyy"), new Date("輸入讀取資料的結束日期mm/dd/yyyy"));

        //Add the metric to pull from the visitor count
        tl.addMetric('ga:visitors', 'Visits');

        //Add metric for bounces
        tl.addMetric('ga:bounces', 'Bounces');

        //Set Google visualization options for line colors
        tl.setOption('colors', ['red', 'orange', 'yellow', 'green']);

        //Set Google visualization option for chart title
        tl.setOption('title', 'My Timeline');

        //draw in the div element with id 'timeline'
        tl.draw('timeline');
      });
    </script>
    <div id="timeline"></div>
  </body>
</html>
將oocharts.js和timeline.html放到網站根目錄,瀏覽timeline.html測試資料是否能讀取成功。可自行寫CSS配合網站模版嵌入,本站首頁可當做參考︰
讀取參數請參考Google Analytics API Dimensions & Metrics Reference,圖表繪製請參考Google Charts Gallery API有提供多種圖表輸出。或者直接到OOcharts官網的Drawing Charts,有實際的範例和代碼說明。
2013/07/23︰OOcharts.org已於昨日正式關閉,新版OOcharts.com需每月收費3美元,新註冊會員有14天試用期。